
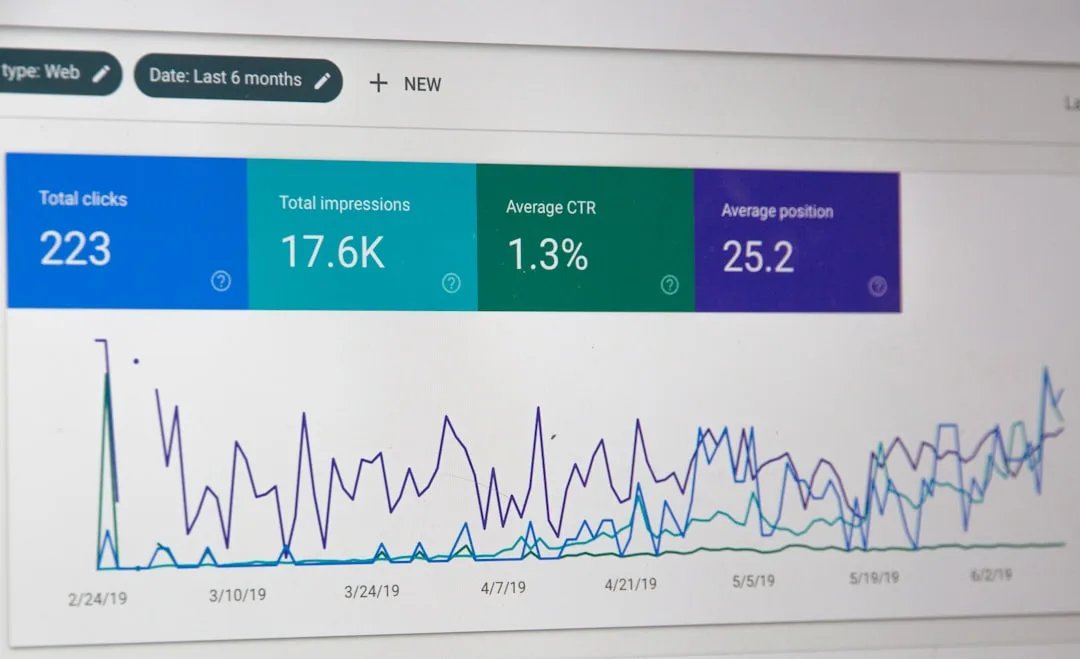
The Video That Worked and Made You Sad
Imagine you published a video, and a week later you opened analytics.
Impressions: a hundred and twenty thousand. A number you've never seen in your life.
Views: fourteen thousand. Also a number you've never seen in your life.
Then you looked at the click-through rate: seven percent.
And you know your previous videos ran around eleven.
So you closed the page feeling like something had gone wrong.
The truth is that this is the most successful video in your channel's history, and the rate fell because it succeeded, not in spite of succeeding.
What Click-Through Rate Actually Measures
It's a simple number: out of every hundred people your video was shown to, how many clicked.
And the phrase "shown to" is the whole story.
The number doesn't measure the quality of the video, or the size of your audience, or anything you spent a week working on. It measures one thing: did you persuade the people who saw you to click.
Which makes it a verdict on your title and thumbnail together, and on nothing else.
Why There's No "Good" Number
The most repeated question on this subject: what's a good click-through rate?
There's no answer to it. And that isn't dodging the question, it is the answer.
The rate shifts dramatically depending on three things.
Where the impressions came from. Appearing on your subscribers' home feed is completely different from appearing to strangers in suggested videos. The first always has a higher rate, not because you improved, but because those people already know you.
The volume of impressions itself. And this is the story we opened with. When the platform takes your video to a wider audience, the rate necessarily falls, because you're being shown to people who don't know you and don't care about your field. A falling rate alongside rising impressions is a sign of success, not failure.
And your field. Specialist content naturally runs a higher rate than general content, because the people seeing it were already interested.
So comparing your rate to a number you read in an article or heard in a video means nothing. The only useful number is your own average across your last ten videos.
Work Out Your Baseline in Five Minutes
Open your last ten videos, write each one's rate on a piece of paper, and take the average.
That's your baseline. From today:
A video clearly above your average means you did something right in the title or thumbnail. Work out what it was and repeat it.
A video clearly below it means the promise didn't land, or the thumbnail couldn't be read on a small phone screen.
A video hovering around the average tells you nothing. Don't analyse it, don't waste your time on it.
Recalculate every three months, because the line moves as your channel grows.
The Trap People Chasing This Number Fall Into
There's one combination that's the most dangerous in all of analytics: a high click-through rate with low retention.
It means people clicked and then left. Which means the title and thumbnail promised something the video didn't deliver.
And its damage goes far beyond one failed video. A viewer who felt tricked once becomes slower to click your next video, and that damage doesn't show up in any number on your screen.
The practical rule: never read click-through rate on its own. Always read it alongside retention.
| Click-through | Retention | What it means |
|---|---|---|
| High | High | The video worked, repeat what you did |
| High | Low | The packaging promises what isn't there, the most dangerous case |
| Low | High | The content is good and isn't reaching people, work on title and thumbnail |
| Low | Low | The subject itself didn't interest anyone |
The third row is the most frustrating case and by far the easiest to fix. You have a good video, and it needs packaging worthy of it.
When to Change the Thumbnail or Title
After at least two days, and after impressions have settled. Changing things in the first hours scrambles your reading of everything.
And change one thing only. The thumbnail or the title, not both. Otherwise you'll never know which one caused whatever happens next.
And don't touch a video that performed well. "Maybe it could be better" costs you the thing you already know works.
In Short
Click-through rate is a verdict on your packaging, not on your video, and it means nothing outside your own context.
Work out your average across ten videos, always read it alongside retention, and change one thing at a time.
And when you see the rate falling while impressions rise, don't be sad. You just left your own circle.